Our emissions
We're doing our part to reduce emissions
The majority of our emissions are associated with our use of electricity (known as scope 2 emissions), while the rest are from direct sources such as methane gas from our water recycling plants.
Annual emissions
We report on our climate change emissions annually (Scope 1 and 2 emissions have been included along with offsets. See our annual reports at Reports strategies and plans | South East Water). These emissions are reported as net emissions in equivalent tonnes of carbon dioxide (CO 2 -e), so different types of greenhouse gasses can be compared. This number is compared to a baseline figure of our average emissions emitted from 2011-2016 (which was 41,744 CO 2 -e per year), so we can see how things have changed.
South East Water’s average annual emissions are:
| Year | Emissions (CO 2 -e) |
|---|---|
| 2019-20 | 33,149.0
|
| 2020-21 | 32,760.9
|
| 2021-22 | 28,576.5*
|
*estimated figure based on data available 1 May 2023
Emissions trajectory
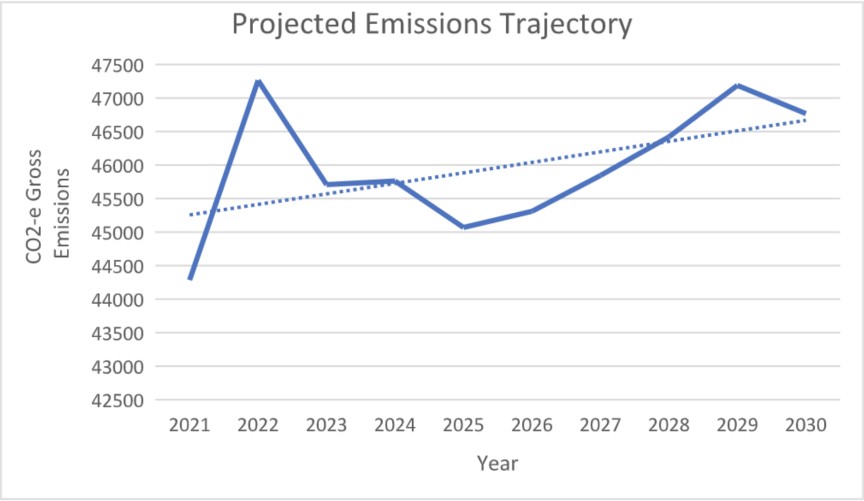
We've predicted our emissions until 2030 based on the information we have available now (Scope 1 and 2 emissions have been included before adding offsets). Measurements are in gross emissions CO 2 -e. Where we cannot reduce our emissions we plan on buying offsets to achieve our goal of net zero emissions. This graph shows a gentle upward trend in the emissions over time, consistent with the growth of the population in Melbourne and to our customers.

What do we emit, and from where?
Scope 1 and 2 emissions have been included before adding offsets.
| Location | Average (CO 2-e) |
Percentage |
|---|---|---|
| Blind Bight Water Recycling Plant | 329.6
|
1% |
| Boneo Water Recycling Plant | 7,578.9 | 21% |
| Koo Wee Rup Water Recycling Plant | 2,620.8 | 7% |
| Lang Lang Water Recycling Plant | 872.1 | 2% |
| Longwarry Water Recycling Plant | 1,536.3 | 4% |
| Mt Martha Water Recycling Plant | 11,138.7 | 31% |
| Pakenham Water Recycling Plant | 7,958.2 | 22% |
| Somers Water Recycling Plant | 4,088 | 11% |