Climate science
Climate change is a threat that has new information coming forward all the time.
Organisations like ours need to stay on top of the latest science and information out there in order to provide the community with the best services possible. When we gather information we like to share it with people so they can make up their own minds and be an educated voice in the crowd.
Key assumptions in our projections
It’s important to remember that climate projections are not precise predictions. Instead they show plausible future scenarios based on a set of assumptions.
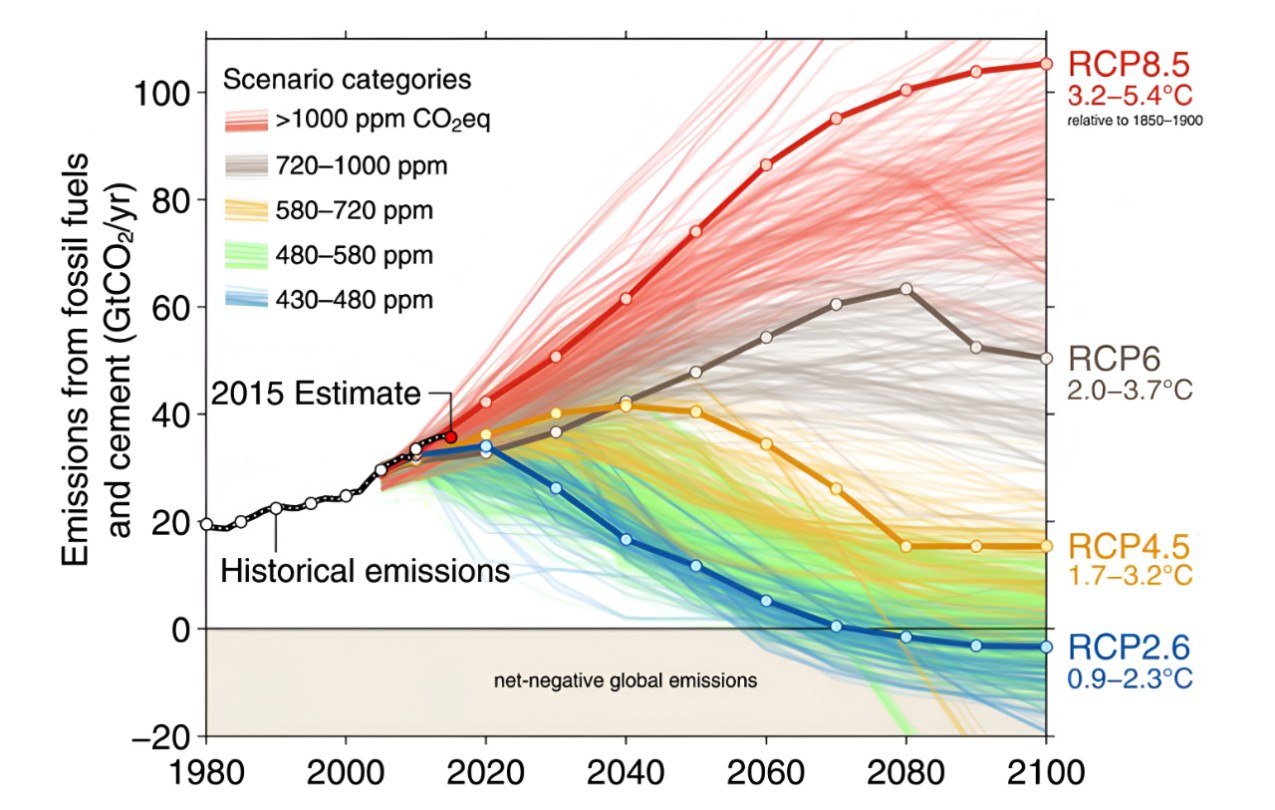
There are many Global Climate Models (GCMs) each with different assumptions. Some are better at predicting certain variables than others. Greenhouse gas emission rates will affect the impacts of climate change. Four internationally recognised concentration trajectories, known as Representative Concentration Pathways (RCPs), are as follows:
- RCP 2.6 CO2 level 420 ppm by 2100
- RCP 4.5 CO2 level 540 ppm by 2100
- RCP 6.0 CO2 level 660 ppm by 2100
- RCP 8.5 CO2 level 940 ppm by 2100
RCPs are predictions about what happens in the future, so the further away it is from today, the less reliable it will be. The higher the RCP, the less we do.
Changes to our local environment
The data is clear - our climate is changing, and this is already impacting us and the communities we serve. A changing climate is a high-priority issue for our board because it presents challenges and uncertainties for our forward planning.
Extreme events (e.g. floods and bushfires), as well as changes to climatic averages (e.g. lower average rainfall), are already affecting our local operations, threatening our ability to solve problems before they impact our customers, community and employees. As an essential service provider, we must prepare for increased demand and extreme events to ensure people have access to water now and into the future.
We've developed our Climate Adaptation Action Plan to proactively respond to the risks of an uncertain climate. It's the responsibility of all our leaders, teams and partner organisations (e.g. contractors, suppliers) to play their role in:
- Using up-to-date evidence on climate change to understand our changing reality.
- Preparing us for these challenges by building consideration of climate change into decision-making.
- Providing low carbon and resilient solutions that improve outcomes and deliver value for our customers.
But no matter how quickly we reduce future greenhouse gas emissions, Victoria has already become warmer and drier. When it does rain, it's projected to fall in more intense bursts that put stress on our infrastructure.
In Melbourne’s south-east, these trends are expected to continue, along with harsher fire weather, rising sea levels, and more very hot days (usually defined as a day with maximum temperature exceeding 35°C).
Learn more about how our climate is projected to look in future and what this could mean for our water cycle.
Climate change in 2030 The risks to your water supply
More frequent bushfires
Fire can damage infrastructure and contaminate water with ash. Bush regrowth surrounding dams and rivers can then absorb up to 50% of the drinking water.
More asset damageLong term reductions in how much water is availableShort term water source contaminationMaintenance and repairs after incidentsReduced rainfall and extreme temperature averages
Drier and hotter weather will gradually reduce available water – but increase our need for it.
Our dams will take longer to fillRiver and groundwater levels will gradually fallSummer use - from drinking and showers to garden watering - will increaseTree roots seeking water will increasingly damage the sewer network, causing leaksDrought and reduced water availability
More frequent and severe dry conditions will occur; without man-made water sources we may not have enough water in drought-time.
Dam levels will be lower and drain quicker, increasingly risking a need for restrictionsManufacturing more water may lead to an increase in billsVery dry soils can shrink, damaging the sewer network and causing leaksExtreme rainfall and flooding events
Increasingly extreme events then flood the network, leading to contamination, damage, and leaks.
Water entering the network can cause more wet weather sewerage spillsSaltwater entering the network causing corrosion and impacting recycled waterLocalised soil erosion, damaging the water and sewer networks and causing leaks
Climate change impacts to our region
Led by the Intergovernmental Panel on Climate Change (IPCC), the scientific community has undertaken an enormous amount of work to help us better understand what the Earth’s climate could become in future.
In Victoria, we're fortunate to have our own set of climate change projections produced by the Commonwealth Scientific and Industrial Research Organisation (CSIRO) and the Department of Energy, Environment and Climate Action (DEECA). These projections use a statistical process called ‘downscaling’ that helps us understand how the climate may change on a more local scale than is possible with global climate models alone.
Key projections for our region and the impacts for South East Water include:
| Variables | Projections | Example impacts |
|---|---|---|
| Days over 35°C | 2030 RCP4.5 36 2090 RCP2.6 39 2090 RCP4.5 51 2090 RCP8.5 85 |
|
| Average rainfall | 2090 RCP8.5 -32 to +23 mm |
|
| Sea level rise and extreme sea level events | 2090 RCP2.6 0.39 m/0.46 m 2090 RCP4.5 0.46 m/0.55 m 2090 RCP6.0 0.47 m/0.56 m 2090 RCP8.5 0.62 m/0.75 m |
|
| Days of severe Forest Fire Danger Index | 2090 RCP4.5 3.8 days 2090 RCP8.5 5.3 days |
|
